
It reads like science fiction…yet it actually makes sense…
—-Important Message From Our Sponsor—-
These 5 simple words activate a woman’s “mental pleasure” centers

There’s a primal part of a woman’s brain that can be revved up with 5 simple words…
And the best thing about this is that it easily fits into everyday conversation.
Her conscious mind won’t pick up on what you’re doing…
…but her unconscious “mental pleasure” centers will be going crazy…
And this will trigger a powerful, compulsive desire inside her… a desire for YOU with no clothes on!
Simply send her sexual cravings into overdrive with this 5 word question
———-
Are sunspots causing the flu? Crazy but true
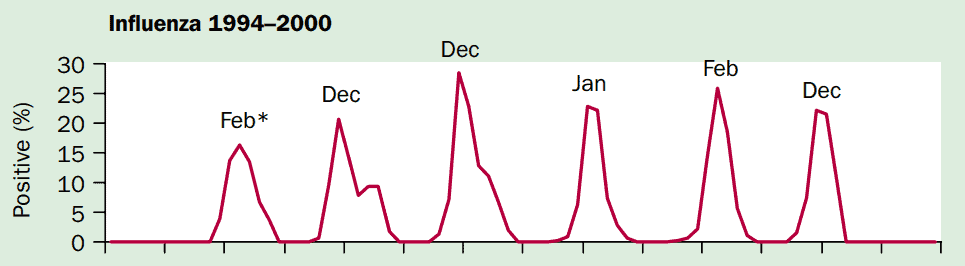
The fact that influenza is characterized by seasonal periodicity has been known for centuries — long before the disease was even known to be viral in nature.
Ever since, many mechanisms were proposed to explain the observation.
“Where do pathogens such as influenza and respiratory syncytial virus (RSV) go in the summertime? Do they migrate across the equator and return the following winter, or do they remain present at low levels in human or animal populations until environmental or host conditions are suitable for re-emergence?” (Dowell, 2004)
It was initially surmised that, since people spend more time indoors in the winter, the spread of the disease is simply a function of close proximity.
Of course, this doesn’t hold up well when considering the substantial amount of time people actually spend indoors in the summertime, as well as the greater distances people travel on average.
So does the viral spread coincide with migratory cycles of certain animals?
Or is this effect a consequence of the school calendar?
Those are a few theories that were proposed over the early years that ultimately fall short of a full explanation.
A somewhat better theory emerged in the 1940s that explains transmission as a function of humidity.
This humidity hypothesis has two explanations:
- One having to do with the level of mucus hydration in the lungs
- The other having to do with the “buoyancy” of airborne virus particles
This theory is actually somewhat convincing and has a bit of experimental proof to support it, some of which continues up to this day (Shaman, 2010).
This effect of humidity was first demonstrated during the WWII years (Loosli, 1943), confirmed two decades later (Shulman, 1962), and further substantiated after the turn of the century (Lowen, 2007).
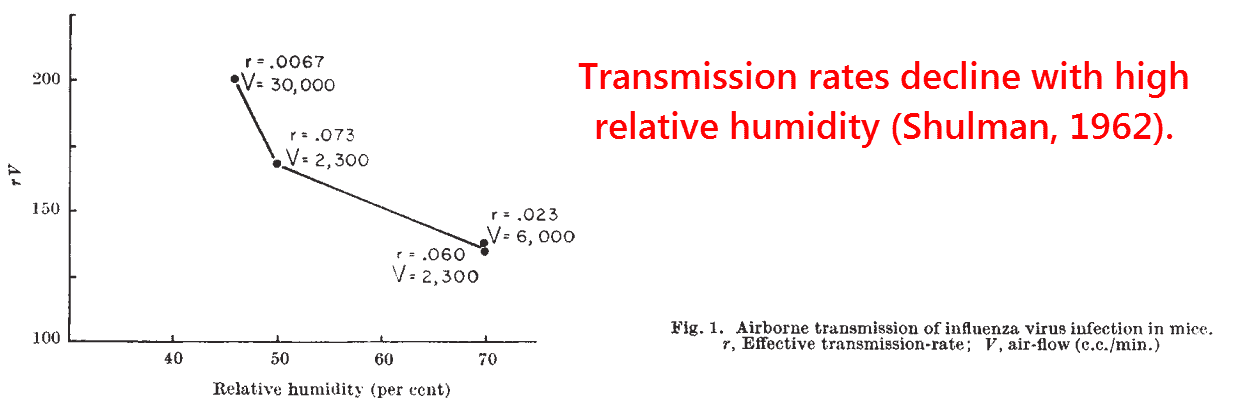
This is made plausible by the concept that aerosolized water-virus particles accumulate water and fall to the ground in humid conditions, yet evaporate and become lighter in dryer conditions.
The particles formed in low humidity would thus persist longer in the airborne state, greatly increasing the potential for transmission.
Yet, despite its plausibility, this theory originated almost a century ago.
We now know that temperature, humidity, and human social behavior aren’t the only things that vary with season.
We must also consider the roles of vitamin D3, melatonin, methoxytryptophol, and catecholamines — immunomodulatory hormones known to display seasonal blood levels.
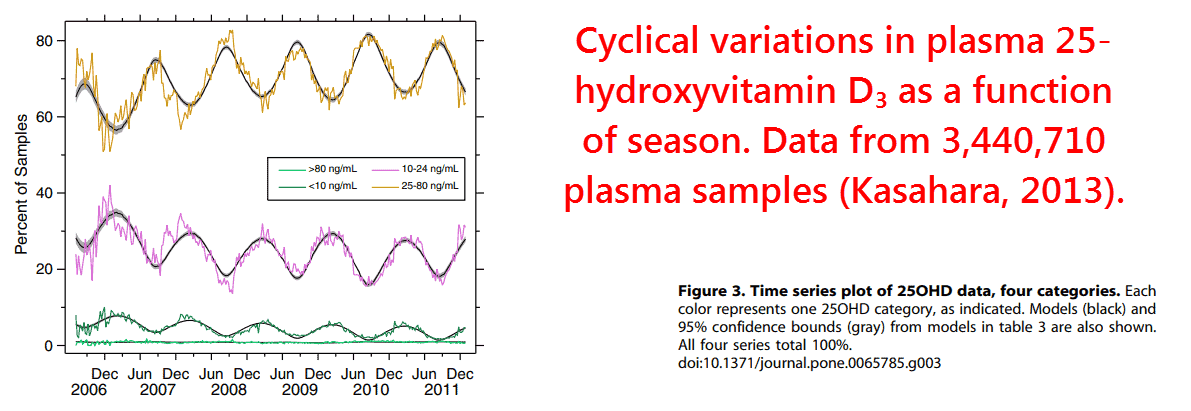
Of this group, vitamin D3 is certainly the most important to consider.
It has the strongest and most consistent seasonal rhythm (Kasahara, 2003), and also the greatest immunomodulatory effects.
Although catecholamines are known to increase in winter in response to coldness, which is also a moderate predictor of viral transmission (Lowen, 2007)…
…vitamin D3 ultimately provides the better explanation (Dobbs, 1993).
It’s been shown that the seasonal effect persists even when temperature and humidity are held constant, thus ruling out everything besides the light-sensitive hormones.
This is supported by the finding that the antibody response to attenuated influenza is reduced in the summertime (Shadrin, 1977).
And that should indicate that the body has cleared the virus before infection could occur.
Another reason is that Norway has only one-half the winter death rates of England attributed to influenza (Laake, 1996).
Norway is colder, drier, and darker than England.
So this observation can only be explained by its government-mandated vitamin D3 food fortification and the population’s fish intake.
In a similar vein, the ubiquity of indoor lighting should attenuate any effects of the pineal hormones (melatonin and methoxytryptophol) in the modern age.
Artificial lighting has no effect on vitamin D3.
Yet it does affect melatonin synthesis because this depends on intensity and not wavelength (McIntyre, 1989).
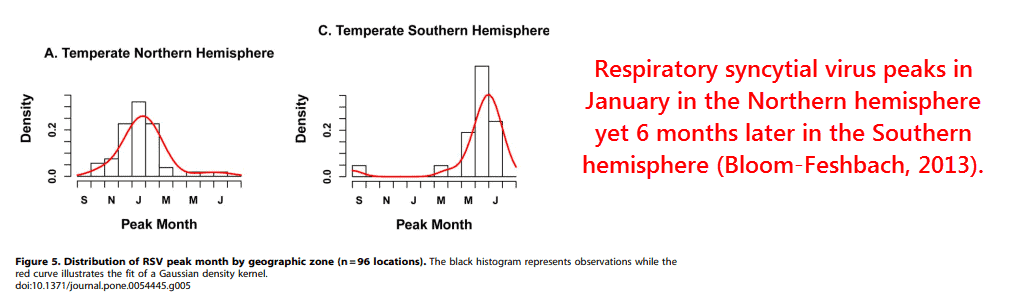
“Seasonal amplitude increased away from the equator, and this was true in both hemispheres.” (Bloom-Feshbach, 2013)
What best explains the historical periodicity of influenza is outdoor sunlight — and, by extension, vitamin D3.
This is supported by the relationship of latitude, a strong indication of sunlight, with the timing of syncytial virus infection.
This also holds true of respiratory infections in general, including the 229E strain of the current virus (Cavallaro, 1970).
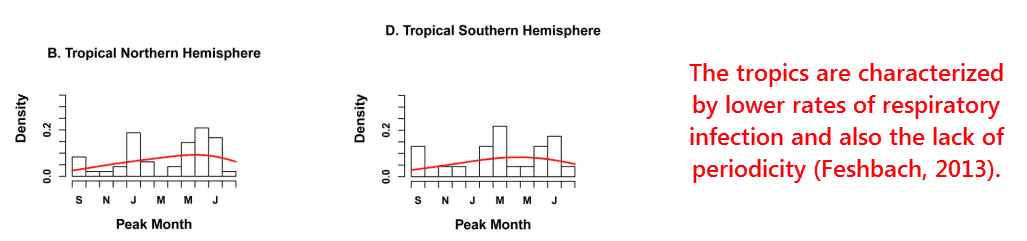
I think we can also rule out the effects of migratory birds, because the tropics have lower rates of respiratory viral infection on average — in addition to the lack of periodicity there.
Any slight increases that occur in the tropics were actually found to be associated with the rainy season (Shek, 2003) — a slap in the face to the humidity hypothesis.
“It is clear that RSV infection is seasonal in the tropics and the weight of evidence points to the fact that it is more common during the rainy season.” (Shek, 2003)
This is entirely consistent with low vitamin D3, because cloud cover during the rainy season, as well as the rain itself, would tend to block ultraviolet light.
Water has a higher refractive index than air, so it bends light to a greater degree — especially ultraviolet light due to its higher frequency.
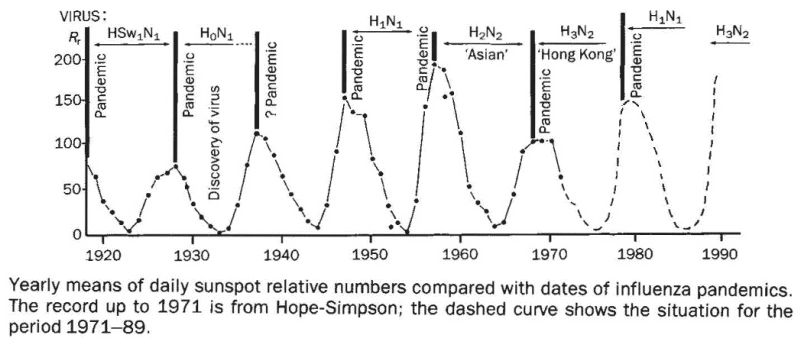
Vitamin D3 can also explain the bizarre association of influenza epidemics with the sunspot cycle (Hoyle, 1990).
Although this may initially sound like science fiction, there’s a logical reason for it.
This is because high sunspot activity is associated with greater atmospheric ozone concentrations (Willett, 1962).
Ozone is responsible for absorbing a good deal of UV light.
So sunspots SHOULD cause 9- to 12-year cycles of unseasonably low levels of plasma vitamin D3.
It is also known that more cosmic rays reach the earth during times of LOW sunspot activity due to the loss of the sun’s magnetic shielding.
These cosmic rays are thought to ionize and deplete ozone, thus increasing the UV light that reaches the earth (Hayes, 2010).
Either way, the result is the same — an increase in respiratory viral epidemics coinciding with low ultraviolet light.
“For seven pandemics over the interval 1700-2000 A.D. agreed upon by referenced historic reviews, the sensitivity of using sunspot numbers [greater than 50] for their detection was found to be 85.7%.” (Hayes, 2010)
This also gains support by direct measurements of serum 25–hydroxyvitamin D3 (the major circulating form of vitamin D).
This was initially reported in children in India (Wayse, 2004).
And then it was confirmed in 800 adult Finnish military recruits using a cutoff point of 40 nM (corresponding to 16.03 ng⁄mL) (Laaksi, 2007).
(nM = nanomolar) (ng⁄mL = nanograms per milliliter)
A subsequent study on Turkish children added more evidence (Karatekin, 2007).
And, finally, a larger study using 18,883 adult subjects and TWO cutoff points was published later:
This was a retroactive analysis of previously collected data from the massive NHANES‑III study conducted between 1988 and 1994.
They used two cutoff points making three categories in total:
- Those under 10 ng⁄mL
- Those between 10-30 ng⁄mL
- And those above 30 ng⁄mL
The three categories showed a perfect trend.
And the increased statistical significance of 18,883 subjects left little doubt about the protective effect of vitamin D3.
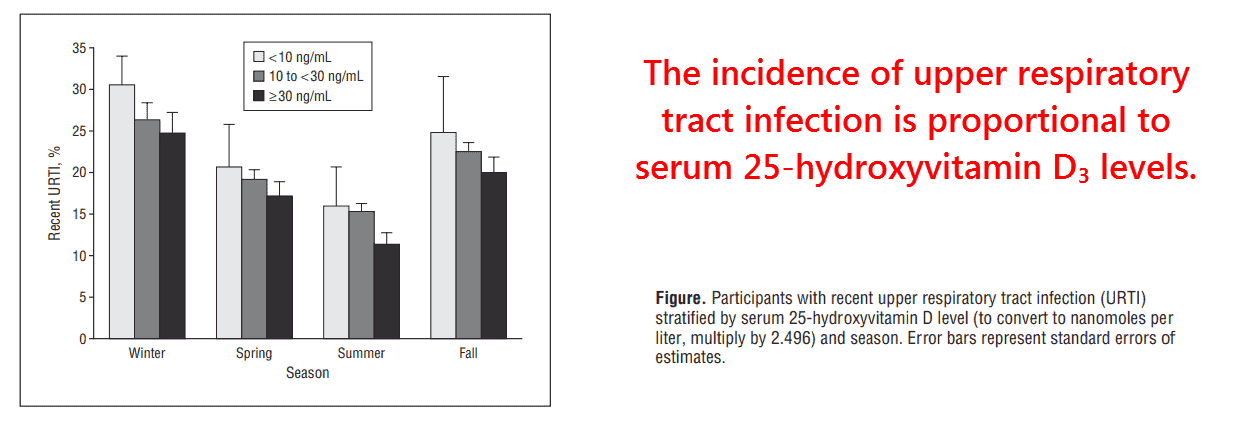
The effect of season remains noticeable in all three categories.
And this could either be an indication that vitamin D3 fluctuates WITHIN categories, or that humidity and/or catecholamines also play a role.
Regardless, it is clear from this data that vitamin D3 exerts a considerable protective effect on UPPER respiratory tract infections.
The data on LOWER respiratory tract infections is even more convincing…
Infants with levels over 50 nM (20.03 ng⁄mL) have a 92% lower incidence than those with anything less (Wayse, 2004).
This was independently confirmed using umbilical cord blood (Belderbos, 2011) (ostensibly because parents object to blood being drawn from their young children).
“Neonates born with 25‑hydroxy‑D3 concentrations less than 50 nM had a sixfold increased risk of developing RSV lower respiratory tract infections in the first year of life compared to those with 25‑hydroxy‑D3 concentrations equal to or greater than 75 nM.” (Belderbos, 2011)
Serum 25‑hydroxyvitamin D3 is also associated with mortality from community-acquired pneumonia, a condition often associated with viral infection.
As with the previous NHANES‑III study, a similar stepwise reduction across three serum levels was observed (Leow, 2011):
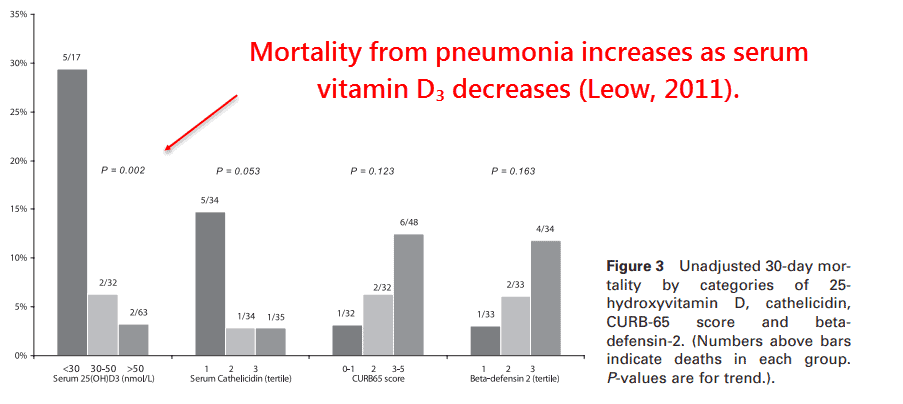
This also correlated with low serum cathelicidin, an antimicrobial peptide upregulated by active vitamin D3 (Wang, 2004).
In fact, cathelicidin is such a powerful endogenous antibiotic that it’s invoked to explain why sunlight was used in the past as a cure for tuberculosis (Selvaraj, 2011).
(endogenous = originating within an organism)
Cathelicidin also has antiviral activity (Barlow, 2014).
It has also been detected in nasal mucus and is expressed in lung epithelia (Hiemstra, 2007).
These findings alone should convince anyone that vitamin D3 is important in antiviral immunity… But there’s more.
It has been shown in more than one study that vitamin D receptor polymorphisms are highly correlated with respiratory viral infection (McNally, 2013).
(Oversimplifying here: polymorphism means there is more than one kind.)
As expected, vitamin D receptors of higher sensitivity were the ones associated with lower infection.
“These findings are consistent with the hypothesis that vitamin D related pathways are implicated in the host immune response to viral respiratory infection.” (Roth, 2008)
Vitamin D3 also passes the supplementation test, which is something like the Koch’s postulates of nutritional causation.
(Koch’s postulates are four criteria established by a microbiologist to identify the causative agent of a particular disease — he worked with anthrax.)
Since antiquity, cod liver oil has been shown to decrease respiratory infections (Holmes, 1932).
And more direct evidence on the effectiveness of D3 supplementation has recently been reported from Japan.
Supplementation of only 1,200 IU per day reduced influenza from 18.6% in the control group to 10.6% in the vitamin D3 group (Urashima, 2010).
This finding is even more notable considering that it was initiated in December.
Vitamin D3 is a lipid-soluble vitamin, so it accumulates over time — often lagging months behind peak sunlight.
Influenza season often begins in January and sometimes even December, so the effect would have certainly been more pronounced had the supplementation in the Japanese study begun in October.
“It reportedly takes about 3 months to reach a steady state of vitamin D concentrations by supplementation. Thus, December might be theoretically too late to start supplementation. However, in this study, vitamin D3 significantly reduced the incidence of influenza within 60 days.” (Urashima, 2010)
This is likely why the supplementation group only had a 5.4% incidence of influenza between 31 and 60 days after initiation.
Compare this to 13.2% in the placebo group during the same timeframe.
So even though humidity and catecholamines probably also play a role, the seasonal periodicity of respiratory infections is best explained by vitamin D3.
—-Important Message for Men Wanting to Avoid Illness—-
How you can protect yourself this cold and flu season
This year alone, over 38 million people have caught the flu.
Of those 38 million, over 400,000 people were hospitalized due to complications.
But the worst part:
Projections for this year are already showing this cold and flu season could be the worst one yet.
And that’s not even taking into account the virus that’s still ravaging the world…
So, what can you do to stay healthy in this world of sickness?
Well here’s what I’m doing — I’m using my very own flu and virus protocol that boosts my body’s natural immunities, so I don’t need the jab in the arm…
And all it involves is taking a few cheap supplements you can find at almost any health store…
———-

[2] Bloom-Feshbach, Kimberly. "Latitudinal variations in seasonal activity of influenza and respiratory syncytial virus (RSV): a global comparative review." PloS one (2013) https://www.ncbi.nlm.nih.gov/pmc/articles/PMC3573019/
[3] Lowen, Anice. "Influenza virus transmission is dependent on relative humidity and temperature." PLoS Pathogens (2007) https://www.researchgate.net/profile/Anice_Lowen/publication/5893228_Influenza_Virus_Transmission_Is_Dependent_on_Relative_Humidity_and_Temperature/links/00b4951e9598ed2e7f000000.pdf
[4] Urashima, Mitsuyoshi. "Randomized trial of vitamin D supplementation to prevent seasonal influenza A in schoolchildren." The American journal of clinical nutrition (2010) https://jeffreydachmd.com/wp-content/uploads/2014/01/Vitamin-D-supplementation-to-prevent-influenza-A-in-schoolchildren-Urashima-Mitsuyoshi-Am-j-clin-nut-2010.pdf
[5] Hoyle, F. "Sunspots and influenza." Nature (1990) https://www.nature.com/articles/343304a0.pdf?origin=ppub